
TB 9-6625-2259-24
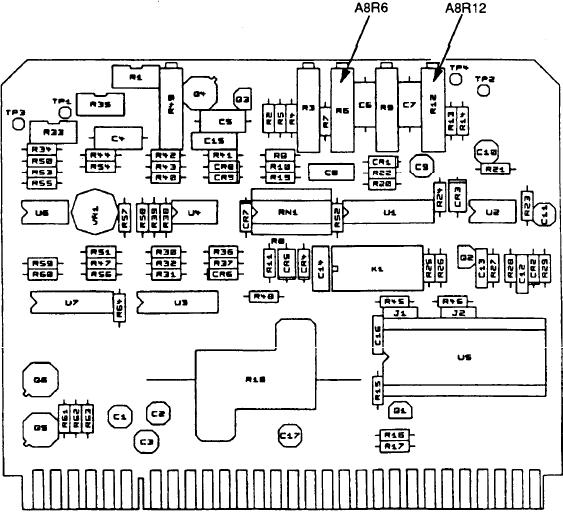
Figure 3. A4A2A8 component location diagram.
(4) Press FREQUENCY RANGE CWF1 key and set F1 M3 display to 0.010 GHz
by pressing 10 with DATA ENTRY keys and then by pressing MHz/dB/msec DATA
ENTRY key.
(5) Adjust spectrum analyzer controls to view TI fundamental signal near center
frequency graticule on spectrum analyzer display. Note position of second harmonic and
subharmonics signals on spectrum analyzer display.
NOTE
Adjust spectrum analyzer controls as necessary to view
fundamental, second harmonic and subharmonic signals for
(6) below.
(6) Slowly increase TI frequency to 2.000 GHz by rotating INCR DECR control cw.
Maintain signal near center graticule line of display with spectrum analyzer controls.
Second harmonic amplitude on spectrum analyzer display will be less than -25 dBc (25 dB
below carrier level indicated on spectrum analyzer display) and subharmonic amplitudes
will be less than -25 dBc (25 dB below carrier level indicated on spectrum analyzer display).
12

