
TB 9-6625-2309-35
L 15.0
O
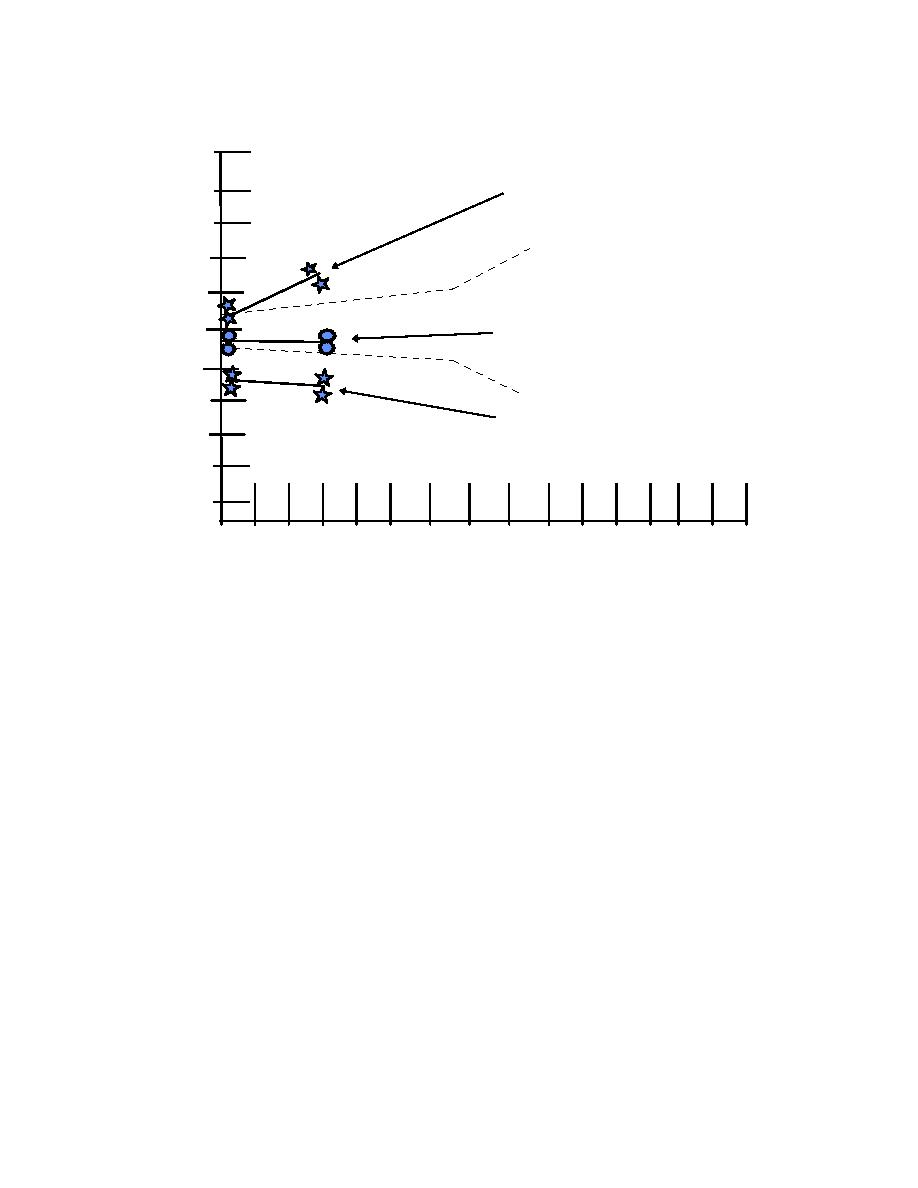
LEAST SQUARES LINE: SLOPE
C 12.0
IS INDICATION OFCRYSTAL
A
OSCILLATOR FREQUENCY
9.0
OUT OF TOLERANCE (TM 11-
T
6625-3271-40, PARA 2-39)
I 6.0
O
N 3.0
LEAST SQUARES LINE
0.0
ACCEPTABLE POSITION
E
R
-3.0
R
-6.0
LEAST SQUARES LINE WITH
O
OFFSET INDICATION SHOWING
R
-9.0
OUT OF TOLERANCE CONDITION
OF ZERO- KM SETTING
[ -12.0
M -15.0
]
0
10
20
30
40
50
60
70
80
90 100 110 120 130 140 150
MEASURED DISTANCE [KM]
Insertion Delay [nanosec]
: 209
Index of Refraction
: 1.4990
OFTS Horizontal
Scale
Wavelength [nm]
: 850
Pulse width
: Short
Model: TS-4320
Date: 12-9-94
Location Offset [m]
: -0.95
Main Frame SN: 9305-0003
Optical Module SN: 9307-0119
Scale Deviation [m/km]
: -0.0128
Model Name: TD-260C
Maximum Readout error [m]
: 1.00
Figure 7. Examples of graphic report (screen). `Least squares line' between dashed boundary lines is
acceptable. (Only one `least squares line' will be displayed at a time.) Other `least squares
lines' are explained in NOTE below.
NOTE
Data for each TS-4320 OFTS optical module is divided into two
sets or clusters - first cluster near origin and second near end
of optical module horizontal scale rated dynamic range. TI
measurement data is taken for each cluster until a shift is
produced in pulse position. The last data point in cluster will
be lowest actual error for that cluster. The data point
immediately prior to the last data point is the highest error.
Technique is same for second cluster. These four data points
are used to plot a least squares line and calculate location
offset, scale deviation, and maximum location readout error.
Location offset is Y axis intercept of least squares line fitted to
15

