
TB 9-6625-2144-24
(4) Adjust TI signal generator output frequency to 8.5 GHz (15.8 GHz), using
technique of (a) through (d) below:
(a) Slowly adjust FREQUENCY control until SET POWER meter indication
dips sharply. Note FREQUENCY MC/10 dial indication.
(b) Slightly increase or decrease toward 8.5 GHz (15.8 GHz) SIGNAL FREQ
control setting and readjust PHASE control to maintain peak indication of power meter.
(c) Continue process of (a) and (b) above until a sharp dip occurs when
FREQUENCY MC/10 dial indicates 850 (1580).
(d) When TI signal generator frequency is set at displayed point, turn
FREQUENCY MC/10 dial to a point at least 100 MHz away from TI signal generator
frequency and adjust POWER SET control for indication of SET POWER on SET
POWER meter.
(5) Set measuring receiver to establish a reference at 8.5 GHz (15.8 GHz).
(6) Set TRAN/TEST/RECV switch to RECV and adjust DBM control to -45.
(7) Measure attenuation with measuring receiver. The measuring receiver will
display an indication between 33.5 to 36.5 dB. Add power meter indication recorded in
10 a (3) above, and total value will be between -43.5 to -46.5 dBm and record value. (If
making a new correction chart, value recorded in this step will be expressed as a negative
number example: -46.5 dBm).
(8) Adjust measuring receiver to establish a new reference.
(9) Adjust DBM control to -50 and measure attenuation. Measuring receiver will
indicate a reading between 3.5 and 6.5 dB. Add power meter indication recorded in 10
a (3) and measuring receiver indication recorded in 12 a (7) above. Total value will be
between 48.5 to 51.5 dBm. (If making a new correction chart, value recorded in this step
will be expressed as a negative number example -51.5 and record value.)
(10) Repeat technique of (9) above for settings listed in table 6. Total recorded value
will be within limits specified.
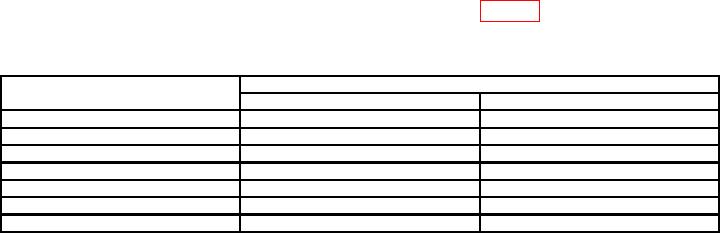
Table 6. Attenuation Dial Accuracy
Total recorded value1
Test instrument
DBM control indications
Min
Max
-55
8.5
11.5
-60
13.5
16.5
-65
18.5
21.5
-70
23.5
26.5
-75
28.5
31.5
-80
33.5
36.5
-85
38.5
41.5
1Total
recorded values are derived by adding power meter recorded indications in 10 a (3), measuring receiver recorded
indications in 12 a (7), and measuring receiver recorded indications in 12 a (10) (Example -10 -35 -10 = -55 dB).
b. Adjustments. No adjustments can be made; however, a new correction chart
will be prepared and attached to TI if necessary.
10

