
TB 9-6625-1914-24
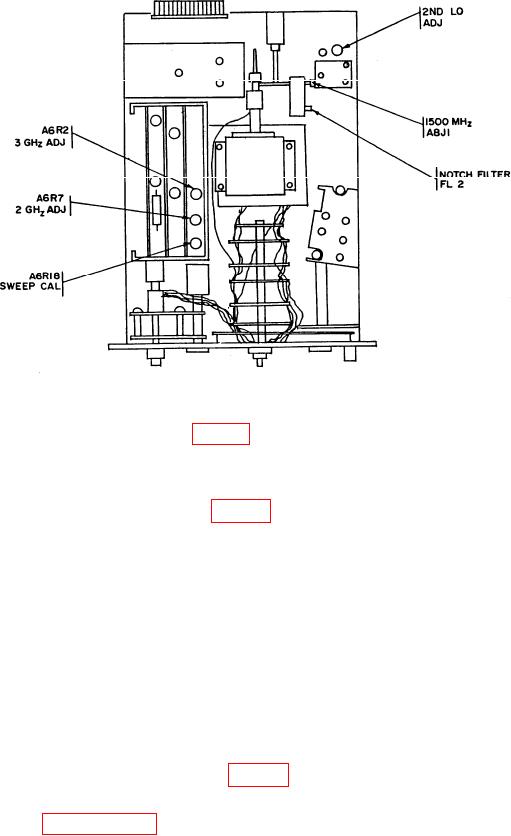
Figure 11. Test instrument - adjustment locations.
(7) Adjust A6R2 3 GHz ADJ (fig. 11) to place local oscillator feed-through signal at
center graticule line on display (R).
(8) Adjust FREQUENCY control for 1000.0 MHz.
(9) Adjust A6R7 2 GHz ADJ (fig. 11) to place 1000 MHz signal pip at center
graticule line on display (R).
(10) Set SCAN WIDTH PER DIVISION switch to 2 MHz and repeat (6) through (9)
above until displayed pip appears within 1 division of center graticule line with
FREQUENCY control settings of 0 and 1000 MHz.
(11) Set BANDWIDTH switch to 300 kHz and SCAN WIDTH PER DIVISION
switch to 100 MHz.
(12) Adjust FREQUENCY and FREQUENCY FINE TUNE controls to place local
oscillator feed-through signal at left graticule line.
(13) Adjust signal generator for output frequencies of 200, 400, 600, 800, and 1000
MHz, respectively. Note position of signal pips on display.
(14) Adjust A6R18 SWEEP CAL (fig. 11) to position pips to coincide with their
respective graticule lines (R).
(15) Repeat paragraphs 26 a through 27 a above.
36