
TB 9-4931-540-24
14. Noise
a. Performance Check
(1) Ensure TI front panel inputs are open.
(2) Press and enter values using ENTRY keys as listed in (a) through (e) below:
ENTRY INSTR PRESET.
(a)
SWEEP ENTRY MANUAL to 39.123456 MHz.
(b)
ENTRY REFERENCE LEVEL to -60 dBm.
(c)
RBW-VBW-ST ENTRY RES BW to 30 kHz.
(d)
RBW-VBW-ST ENTRY VIDEO BW to 1 Hz.
(e)
(3) Average TI marker amplitude indication will be < -100 dBm.
(4) Press RBW-VBW-ST ENTRY RES BW key.
(5) Press ENTRY STEP
key.
(6) Average TI marker amplitude indication will be < -104 dBm.
(7) Repeat technique of (5) and (6) above for remaining TI settings and indications
listed in table 8.
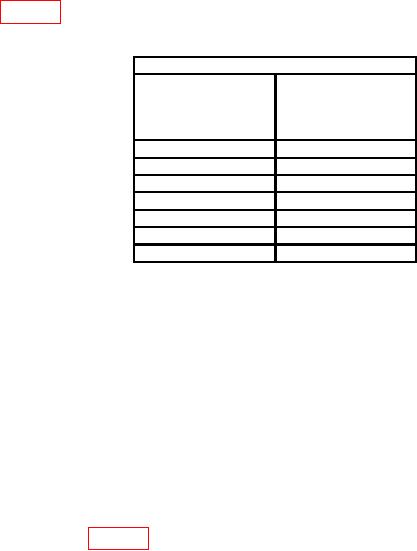
Table 8. Noise
Test instrument
RBW-VBW-ST
Average marker
ENTRY RES BW
amplitude
settings
indications
(dBm)
3 kHz
< -108
1 kHz
< -111
300 Hz
< -115
100 Hz
< -122
30 Hz
< -127
10 Hz
< -132
3 Hz
< -137
(8) Press and enter values using ENTRY keys as listed in (a) and (b) below:
(a) RBW-VBW-ST ENTRY RES BW to 30 kHz.
(b) ENTRY REFERENCE LEVEL to 45 dBm.
(9) Repeat (3) through (7) above.
(10) Press and enter values using ENTRY keys as listed in (a) through (c) below:
(a) ENTRY REFERENCE LEVEL to -60 dBm.
(b) RBW-VBW-ST ENTRY RES BW to 30 kHz.
(c) SWEEP ENTRY MANUAL to 300 kHz.
(11) Average TI marker amplitude indication will be <-100 dBm.
(12) Repeat technique of (10) (b), (c), and (11) above for remaining TI settings and
indications listed in table 9.