
TB 9-6625-1098-24
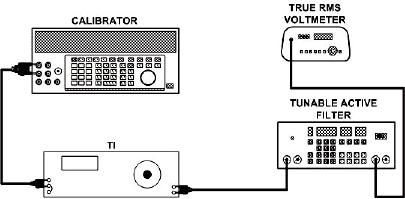
Figure 3. Fundamental frequency rejection - equipment setup.
(2) Position TI controls as listed in (a) through (g) below:
FUNCTION switch to VOLTMETER.
(a)
METER RANGE switch to 1 VOLT.
(b)
MODE selector switch to MANUAL.
(c)
FREQUENCY RANGE switch to X10.
(d)
FREQUENCY dial to 50.
(e)
SENSITIVITY switch to MAX.
(f)
SENSITIVITY VERNIER control to MIN.
(g)
(3) Adjust electronic filter for a 500 Hz bandpass frequency.
(4) Adjust calibrator frequency to 500 Hz and output level for a 1 V indication
on TI meter.
(5) Set FUNCTION and METER RANGE switches to SET LEVEL.
(6) Adjust SENSITIVITY and VERNIER controls for a 0 dB indication on TI
meter. Record true rms voltmeter dB indication.
(7) Set FUNCTION switch to DISTORTION.
(8) Adjust FREQUENCY dial and BALANCE controls for a null indication on TI
meter. When TI indication is less than 10% on the 0 to 10% (SET LEVEL) scale, set
MODE switch to AUTOMATIC.
(9) Reduce METER RANGE switch as necessary to maintain an on-scale reading.
NOTE
Each decrease in the METER RANGE switch represents 10
dB of fundamental rejection; therefore, the total fundamental
rejection is the sum of the TI METER RANGE setting and the
true rms voltmeter amplitude reading.
(10) Add dB readings of METER RANGE switch and true rms voltmeter. Total dB
change will be greater than 80 dB below indication recorded in (6) above.
(11) Set METER RANGE switch to 0 dB, MODE switch to MANUAL and
FUNCTION switch to SET LEVEL.
16