
TB 9-6625-1098-24
(12) Repeat (2) through (10) above, using TI control settings and frequencies listed in
Table 8. Fundamental Frequency Rejection
Test Instrument
Calibrator
Electronic filter cut-off
frequencies
frequencies
RANGE
(kHz)
(kHz)
dial settings
switch settings
X100
50
5
5
X1K
50
50
50
951
X10K
10
95
1Total
change will be at least 70 dB below indication recorded in (4) above.
b. Adjustments. No adjustments can be made.
18. Fundamental Frequency Rejection (Alternate Method)
a. Performance Check
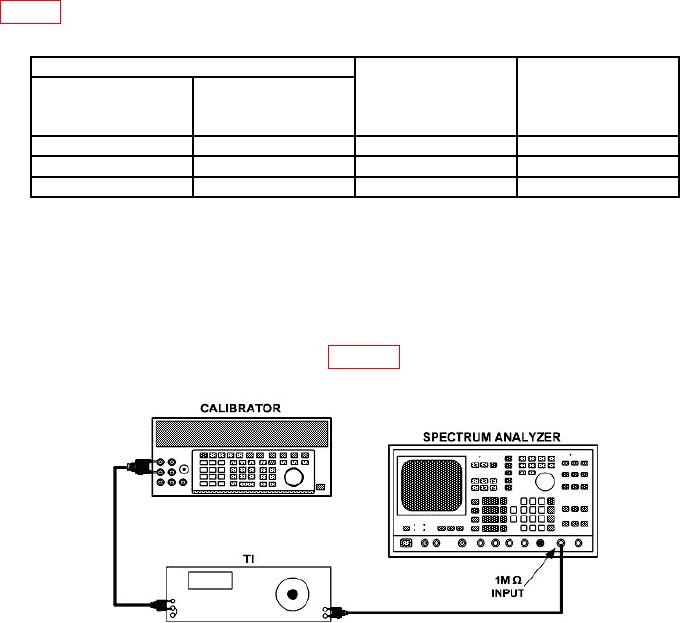
(1) Connect equipment as shown in figure 4.
Figure 4. Fundamental frequency rejection (alternate method) - equipment setup.
(2) Repeat 17 a (2) and (4) through (5) above.
(3) Adjust SENSITIVITY and VERNIER controls for a 0 dB indication on TI
meter. Record spectrum analyzer 500 Hz signal amplitude (as reference).
(4) Repeat 17 a (7) and (8) above.
(5) Add dB readings of METER RANGE switch and spectrum analyzer signal
amplitude. Total dB change will be greater than 80 dB below indication recorded in (3) above.
(6) Set METER RANGE switch to 0 dB, MODE switch to MANUAL, and
FUNCTION switch to SET LEVEL.