
TB 9-6625-2340-24
(26) Amplitude indicated on TI display will be within limits specified in table 30.
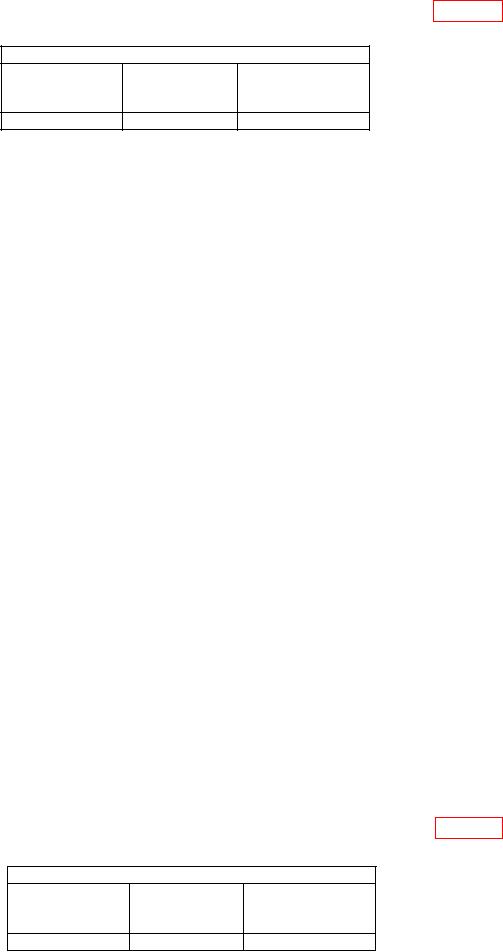
Table 30. Residual Response (12.4 GHz to 18.0 GHz)
Test instrument
Displayed
Start
Stop
amplitude limit
frequency
frequency
(dBm)
85
12.4 GHz
18.0 GHz
b. Adjustments. None.
22. Harmonic Distortion
a. Performance Check
(1) Press TI keys as listed in (a) through (d) below:
2-22 GHz.
(a)
CENTER FREQUENCY, 230, MHz.
(b)
SPAN, 100, kHz.
(c)
REFERENCE LEVEL, 30, dBm.
(d)
(2) Connect signal generator RF output connector to one end of the 250 MHz low
pass filter.
(3) Connect TI 10 MHz OUT (rear panel) to signal generator external reference in
connector (rear panel).
(4) Connect TI RF INPUT to the other end of the 250 MHz low pass filter.
(5) Set up signal generator for an output frequency of 230 MHz at an output level of
30 dBm.
(6) Adjust signal generator output level to position the trace at reference level (top)
graticule line.
(7) Press TI keys as listed in (a) through (i) below:
DISPLAY LINE ENTER, 110, dBm.
(a)
MARKER PEAK SEARCH.
(b)
MARKER CF.
(c)
STEP SIZE.
MARKER/
(d)
CENTER FREQUENCY.
(e)
.
(f)
FREQUENCY SPAN, 10, kHz.
(g)
VIDEO BW, 30, Hz.
(h)
RES BW, 30 Hz.
(i)
on TI display to disappear.
(8) Wait for
(9) Press TI MARKER PEAK SEARCH key.
(10) Amplitude indicated on TI display will be within limits specified in table 31.
Table 31. Harmonic Distortion (230 MHz)
Test instrument
Displayed
Center
Displayed
amplitude limit
frequency
(dBm)
110
230 MHz
Second