
TB 9-6625-2340-24
19. Line Related Sidebands
a. Performance Check
(1) Connect TI CAL OUTPUT to TI RF INPUT.
(2) Press TI 2-22 GHz, RECALL, 9.
(3) Adjust TI FREQ ZERO for a maximum amplitude trace.
(4) Press TI keys as listed in (a) through (c) below:
2-22 GHz.
(a)
CENTER FREQUENCY, 100, MHz.
(b)
FREQUENCY SPAN, 1.2, kHz.
(c)
(5) Wait for asterisk in upper right corner of TI display to disappear.
(6) Press TI keys as listed in (a) through (c) below:
MARKER PEAK SEARCH.
(a)
MKR CF.
(b)
MKR REF LVL.
(c)
(7) Wait for asterisk in upper right corner of TI display to disappear. Trace should
be centered on display.
(8) Press TI keys as listed in (a) and (b) below:
(a) SHIFT, VIDEO BWG.
(b) SWEEP SINGLE, 10, Hz.
(9) When TI display VID AVG readout is 10, press TI keys as listed in (a) through
(e) below:
SHIFT.
(a)
TRACE B BLANK.
(b)
TRACE A VIEW.
(c)
MARKER PEAK SEARCH.
(d)
MARKER .
(e)
(10) Adjust TI DATA knob to move the MARKER to the point on the displayed
trace at which the marker frequency indication is 120 Hz.
(11) TI marker
amplitude will indicate within limits specified in first row of table 24.
(12) Repeat technique of (10) and (11) above for remaining marker settings in table 24. TI
marker amplitude displayed will indicate within limits specified in table 24.
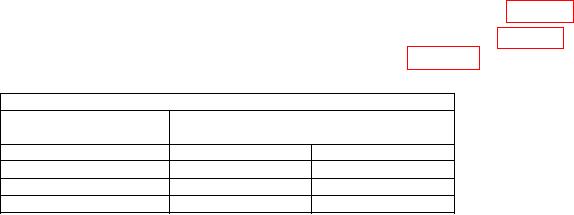
Table 24. Line Related Sidebands
Test instrument
Line sideband
Marker amplitude displayed
(Hz)
(dB)
Min
Max
120
100
70
180
100
70
240
100
70