
TB 9-6625-2340-24
(24) Press TI MARKER NORMAL and adjust the TI DATA knob to move the
marker to the highest and lowest points of displayed amplitude. The amplitude deviation
will be within limits specified in table 18.
Table 18. Frequency Response (100 kHz to 80 MHz)
Test instrument
Displayed amplitude
(dB)
Min
Max
0
1.2
(25) Disconnect TI RF INPUT from function/arbitrary generator SIGNAL
OUTPUT.
(26) Connect measuring receiver sensor module to measuring receiver power
reference output.
(27) Zero and calibrate the sensor module.
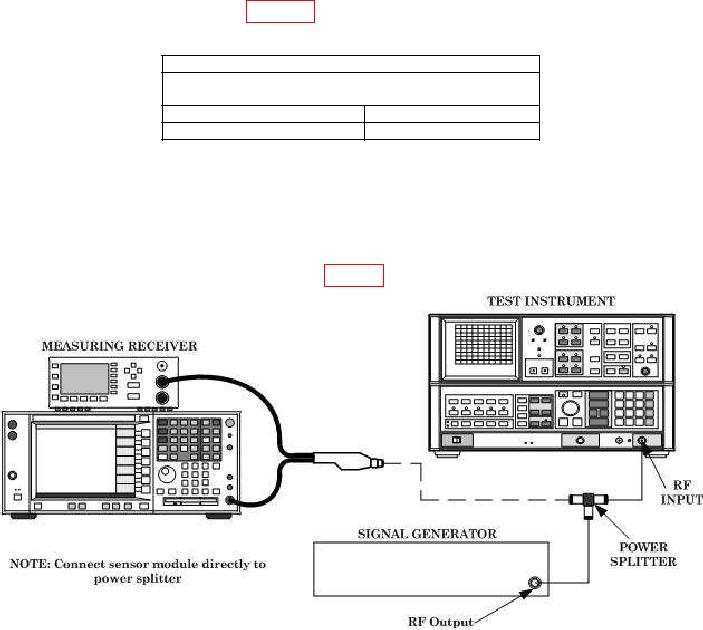
(28) Connect equipment as shown in fig. 27.
Figure 27. Frequency response connection 1.
(29) Press TI keys as listed in (a) through (f) below:
0-2.5GHz.
(a)
TRACE A CLEAR-WRITE.
(b)
CENTER FREQUENCY, 100, MHz.
(c)
FREQUENCY SPAN, 10, MHz.
(d)
SWEEP CONT.
(e)
LOG dB/DIV, 1, dB.
(f)
(30) Set signal generator frequency to 100 MHz and level output to 4 dBm.
(31) Set up measuring receiver to measure power at 100 MHz.
(32) Adjust signal generator RF output level for a measuring receiver indication of
2.0 0.1 dBm.
50