
TB 9-6625-2134-24
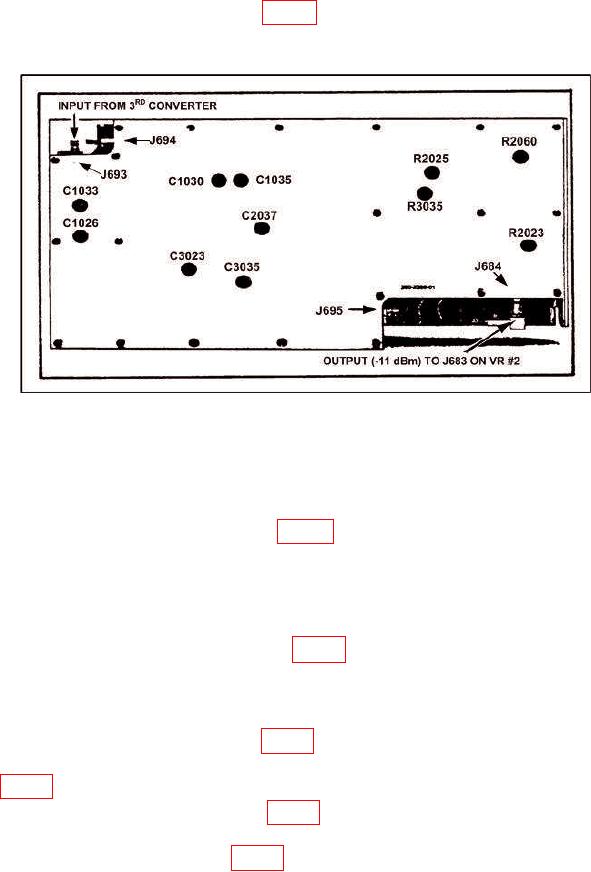
(249) Adjust C3023 and C3035 (fig. 20) for optimum shape and frequency centering
on crt display.
Figure 20. Adjustment Location - VR #1 Module.
(250) Adjust RESOLUTION BANDWIDTH control to 20 kHz and center signal
on crt with FREQUENCY control.
(251) Adjust RESOLUTION BANDWIDTH control to 1 MHz and FREQ
SPAN/DIV control to 500 kHz.
(252) Adjust C1033 and C1026 (fig. 20) for optimum response and centering of
signal on crt.
(253) Adjust FREQUENCY SPAN/DIV control to 5 kHz and RESOLUTION
BANDWIDTH control to 10 kHz.
(254) Center signal on crt with FREQUENCY control.
(255) Adjust C2037 (10 kHz) filter (fig. 20) for a bandwidth of 20 percent at the 6
dB down mark and flat top ripple of <0.5 dB.
SPAN DIV control to 500 Hz.
(257) Adjust C1030 and C1035 (fig. 20) for optimum shape.
(258) Push POWER switch to off and disconnect cable from J683 and reconnect to
J693 (fig. 17) (VR #1).
(259) Reconnect P683 and J683 (fig. 17) and pull POWER switch to on.
(260) Repeat technique of (226) through (230) above for control settings and
corresponding adjustments listed in table 4 for optimum amplitude and waveform.
35