
TB 9-6625-2249-24
(8) Adjust synthesized signal generator level control for a TI POWER LEVEL
meter indication of +19.0 dBm. Record power meter indication in table 4.
(9) Disconnect power meter from point A of figure 3.
(10) Repeat technique of (4) through (9) above for remaining frequencies listed in
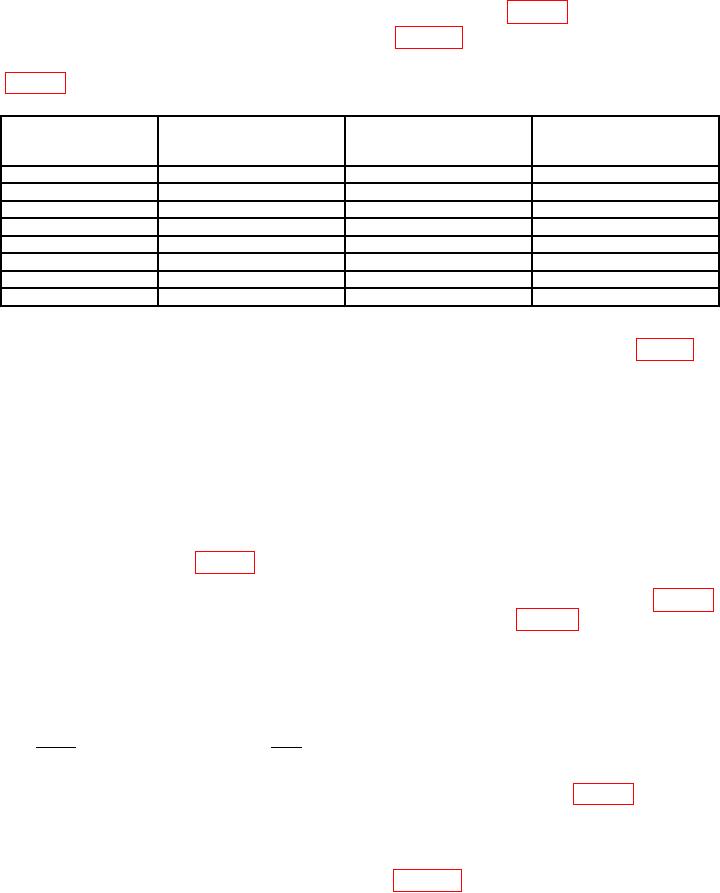
Table 4. Leveled Output Power and Flatness
Synthesized signal
Corrected power
20 dB attenuator (Fixed)
Power meter indications
test report value1 (dB)
indications (dBm)
settings (GHz)
2.0
3.0
5.6
9.7
11.0
15.0
17.0
18.0
1Round
to nearest tenths.
(11) Record 20 dB attenuator (fixed) test report values for frequencies listed in table 4.
NOTE
Treat test report values as negative numbers.
NOTE
Average 20 dB attenuator (fixed) test report values for 1.5 and
3.0 GHz and use results as test report value for 2 GHz.
NOTE
Use same 20 dB attenuator (fixed) test report value for 17 and
18 GHz in table 4.
(12) Algebraically subtract each 20 dB attenuator (fixed) value recorded in table 4
from power meter indication of same row. Record difference in table 4, corrected power
indication column. If corrected power indications are not between 17.5 and 20.5 dBm,
perform b below.
EXAMPLE:
+ 0.1 power meter indication
+ 0.1
--20.1 test report value
+ 20.1
20.2 corrected power indication
(13) Subtract the smallest value from the largest value recorded in table 4, Corrected
power indication column; if the difference is not 2.5 dB or less, perform b below.
b. Adjustments
(1) Connect thermistor mount to point A of figure 4.
8