
TB 9-6625-2273-40
NOTE
It is important to decrease frequency without going below 295
MHz to ensure that adjustment step is made with highest
frequency filter switched into the circuit.
(9) Adjust spectrum analyzer No. 2 controls to view 2d harmonic (590 MHz) of
TI output signal.
NOTE
When performing adjustments in (10) through (24) below, slide
power module top cover back far enough to enable access to
adjustment.
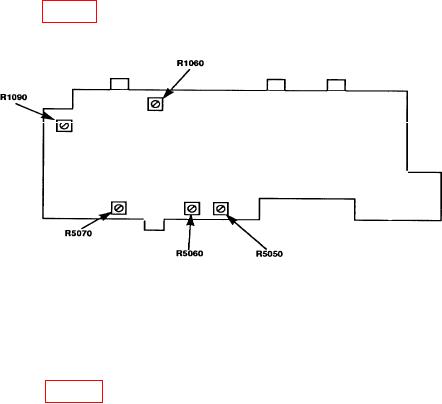
(10) Adjust R1060 (fig. 1) for minimum amplitude as indicated on spectrum analyzer
No. 2 display. Amplitude will be 30 dB below reference point established in (7) above (R).
Figure 1. A7 board adjustment locations.
(11) Adjust spectrum analyzer No. 2 controls to view 3d harmonic (885 MHz) of the
TI output signal. Amplitude of the signal, as indicated on spectrum analyzer No. 2
display, will be 40 dB below reference point established in (7) above. If not, repeat (9)
above and adjust R5050 (fig. 1) until 2d harmonic amplitude is 40 dB below reference
point established in (7) above (R).
(12) Enter 200 MHz on DATA keyboard.
NOTE
It is important to decrease frequency without going below 145
MHz to ensure that this adjustment step is made with middle
frequency filter switched into the circuit.
(13) Rotate TI control knob to decrease output frequency to 145 MHz.
(14) Press DIGIT SELECT pushbuttons to select 1 MHz resolution as indicated by
TI display.
9