
TB 9-6625-2340-24
(17) Press TI REFERENCE LEVEL key to select 0 dB.
(18) Change the synthesizer/level generator output level to 2.00 dBm and amplitude
increments to 0.1 dB steps.
(19) Press TI MARKER PEAK SEARCH and
keys.
(20) Read the amplitude deviation from TI marker
readout. Record displayed
amplitude level in deviation marker amplitude indication column of table 13.
(21) Repeat technique of (16) through (20) above for remaining TI REFERENCE
LEVEL key and synthesizer/level generator settings in table13.
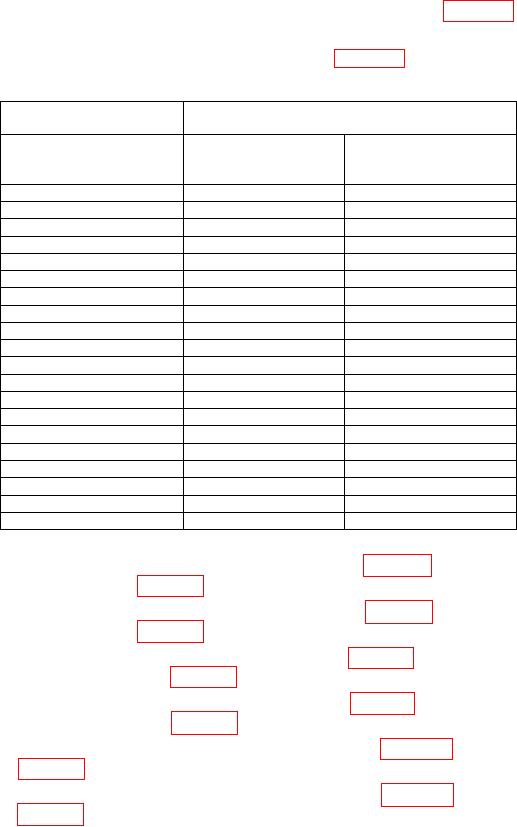
Table 13. IF Gain Uncertainty (0.1 dB Steps)
Synthesizer/level
Test instrument
a eviation marker
D
Amplitude
Reference level
mplitude indication
(dBm)
(dBm)
(dB)
2.00
0.0
2.10
0.1
2.20
0.2
2.30
0.3
2.40
0.4
2.50
0.5
2.60
0.6
2.70
0.7
2.80
0.8
2.90
0.9
3.00
1.0
3.10
1.1
3.20
1.2
3.30
1.3
3.40
1.4
3.50
1.5
3.60
1.6
3.70
1.7
3.80
1.8
3.90
1.9
(22) Find the largest positive deviation recorded in table 11 from 0 to 70 dBm and
record value in column (A) of table 14 below.
(23) Find the largest negative deviation recorded in table 11 from 0 to 70 dBm and
record value in column (B) of table 14 below.
(24) Find the largest positive deviation recorded in table 11 from 80 dBm to 120 dBm
and record value in column (C) of table 14 below.
(25) Find the largest negative deviation recorded in table 11 from 80 dBm to 120 dBm
and record value in column (D) of table 14 below.
(26) Find the largest positive deviation recorded in table 12 and record value in
column (E) of table 14 below.
(27) Find the largest negative deviation recorded in table 12 and record value in
column (F) of table 14 below.
38