
TB 9-6625-2134-24
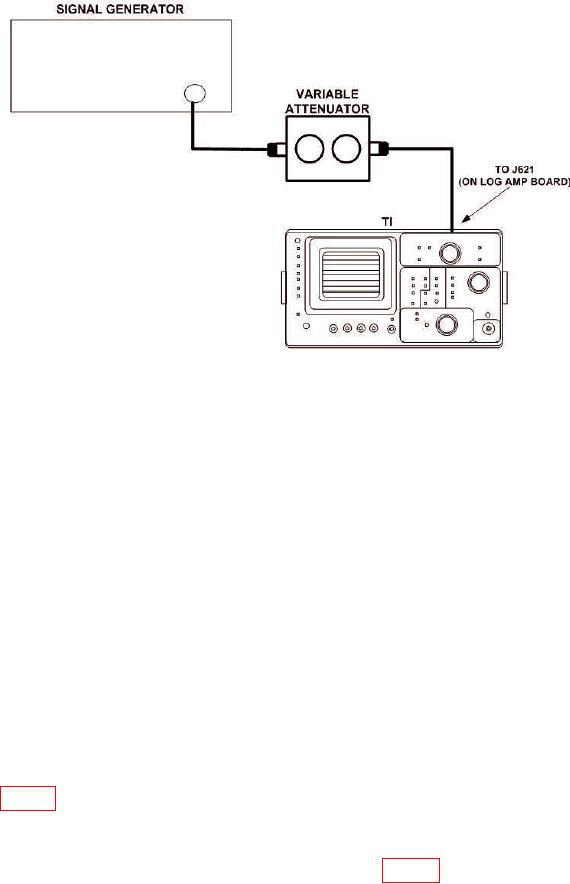
Figure 15. Log Amplifier - Equipment Setup.
(195) Position controls as listed in (a) through (g) below:
(a) REFERENCE LEVEL control to -70 dBm.
(b) MIN RF ATTEN dB control to 0 dB.
(c) FREQUENCY SPAN/DIV control to 200 MHz.
(d) FREQUENCY control to 200 MHz.
(e) TIME/DIV switch to AUTO.
(f) 10 dB/DIV VERTICAL DISPLAY pushbutton on.
(g) CAL LOG and CAL AMPL controls to center of ranges.
(196) Adjust signal generator controls for 10 MHz, 0 dBm output and adjust
variable attenuator for 50 dB attenuation.
(197) Adjust signal generator output to position display on crt to a graticule reference line.
(198) Adjust REFERENCE LEVEL control from -70 to -120 dBm and adjust CAL
LOG control until each 10 dB step equals 1 division.
(199) Adjust REFERENCE LEVEL control to -20 dBm and variable
attenuator for 0 dB.
(200) Increase variable attenuator in 10 dB steps to 60 dB while adjusting
R4020 (fig. 16) until each 10 dB step produces a 1 division change on crt.
(201) Adjust variable attenuator to 0 dB. Display should indicate full screen (0 dBm).
(202) Alternately press 10 dB/DIV and 2 dB/DIV VERTICAL DISPLAY
pushbuttons on and off while adjusting Level R4071 (fig. 16) for minimum amplitude
change between two displays on crt.
29