
TB 9-6625-2134-24
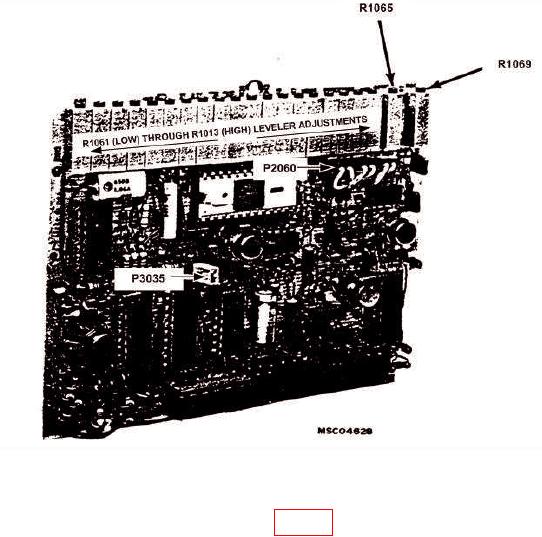
Figure 12. Video Processor - Adjustment and Test Point Locations.
(161) Reinstall video processor board (fig. 12), using service kit extender board and
pull POWER switch to on.
(162) Position controls as listed in (a) through (i) below:
(a)FREQUENCY RANGE pushbutton to 5.4-18 GHz (BAND 4).
(b)FREQUENCY control to 10 GHz.
(c) MIN RF ATTEN dB control to 10 dB.
(d) REFERENCE LEVEL control to -10 dBm.
(e) FREQUENCY SPAN/DIV control to MAX.
(f)
10 dB/DIV VERTICAL DISPLAY pushbutton to on.
(g)AUTO RESOLUTION pushbutton to on.
(h) DIGITAL STORAGE VIEW A & VIEW B pushbutton to off.
(i)
TIME/DIV switch to 10 ms.
(163) Adjust synthesized signal generator for 5.5 GHz cw signal and adjust output
for -10 dBm indication on power meter.
25