
TB 9-6625-2330-24
(12) Set spectrum analyzer marker to normal.
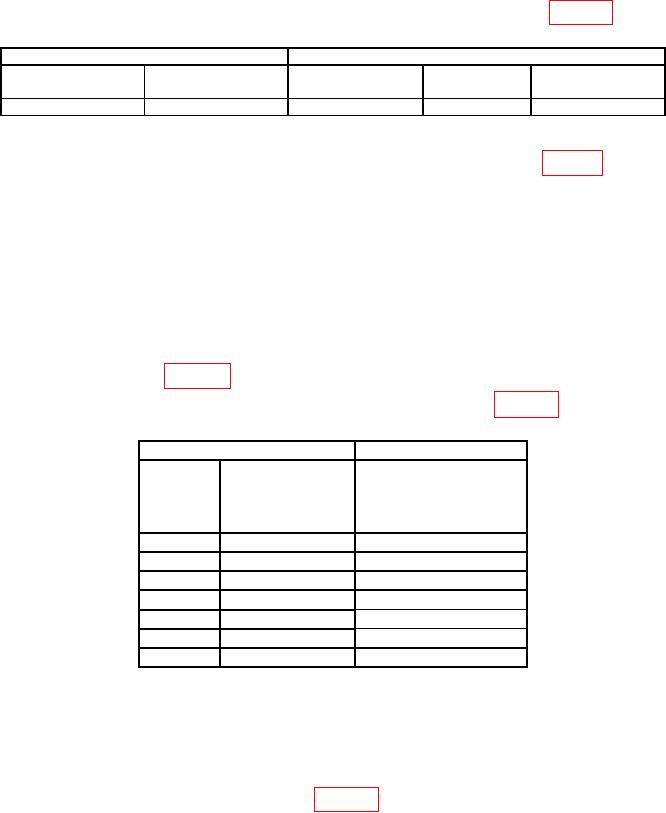
(13) Spectrum analyzer Mkr1 will indicate less than dB limit listed in table 13.
Table 13. Noise Floor.
Test instrument
Spectrum analyzer
DATA ENTRY
DATA ENTRY
dB
Center
Span
indications
level
100 MHz
7 dBm
101 MHz
2.5 kHz
<-87 dBm
(14) Press TI pushbuttons as listed in (a) through (d) below:
(a) FUNCTION-CARR FREQ to first TI frequency listed in table 14 below.
(b) FUNCTION-CARR LEVEL.
(c) DATA ENTRY- 13 dBm.
(d) FUNCTION-RF ON to on (red light lit).
NOTE
Any spurious signals displayed around 160 MHz should be
ignored IAW TM 43-6635-911-14&P.
(15) Using spectrum analyzer, verify that all non-harmonic spurious signals are less
than dBc limit listed in table 14.
(16) Repeat (14) and (15) for remaining frequencies listed in table 14.
Table 14. Spurious Signals.
Test instrument
Spectrum analyzer
DATA
DATA
Spurious signal
ENTRY
ENTRY
level
level
(dBc)
(MHz)
(dBm)
13
25 MHz
<-50
13
50 MHz
<-50
13
100 MHz
<-50
13
225 MHz
<-50
13
450 MHz
<-50
13
750 MHz
<-50
13
1500 MHz
<-50
b. Adjustments. No adjustments can be made.
14. Pulse Modulation
a. Performance Check
(1) Connect equipment as shown in figure 1.
(2) Configure pulse generator for a 10 mS period, 5 mS width, 5 Vhigh, 0 Vlow, 0
delay output.