
TB 9-6625-2340-24
(73) Repeat the technique used in (63) through (72) above using remaining TI and
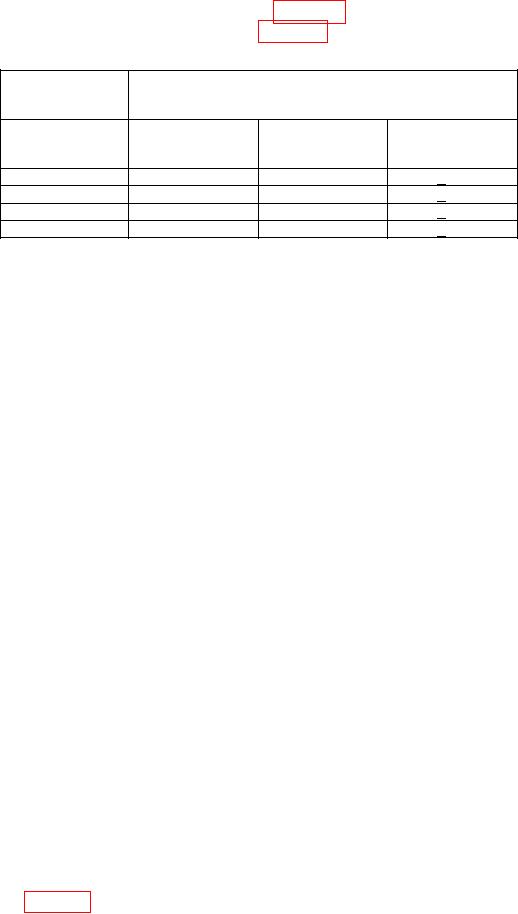
on TI display will be within limits specified in table 42.
Table 42. Multiple Responses
Synthesized
Test
signal generator
instrument
No. 1
Initial center
Measure center
Displayed
Frequency
frequency setting
frequency setting
amplitude limit
(GHz)
(GHz)
(GHz)
(dB)
< 70
5.7
5.7
2.3679
< 50
6.0
6.0
1.1893
< 70
12.0
12.0
8.107133
< 70
12.0
12.0
8.535667
(74) Press TI keys as listed in (a) through (f) below:
SWEEP CONT.
(a)
MARKER NORMAL.
(b)
MARKER OFF.
(c)
FREQUENCY SPAN, 100, kHz.
(d)
CENTER FREQUENCY, 13, GHz.
(e)
REFERENCE LEVEL, 0, dBm.
(f)
(75) Set synthesized signal generator No. 1 output frequency to 13.0 GHz.
(76) Press TI MARKER PRESEL PEAK key and wait for (PEAKING!) on TI
to disappear.
(77) Press TI keys as listed in (a) through (d) below:
MARKER MKR CF.
(a)
MARKER NORMAL.
(b)
MARKER OFF.
(c)
FREQUENCY SPAN, 5, kHz.
(d)
(78) Adjust synthesized signal generator No. 1 output level to place the peak of the
signal trace at the top TI graticule line.
(79) Press TI keys as listed in (a) through (g) below:
MARKER NORMAL.
(a)
MARKER PEAK SEARCH.
(b)
MARKER .
(c)
SWEEP CONT.
(d)
CENTER FREQUENCY, 1.0679, GHz.
(e)
SHIFT, SWEEP CONT.
(f)
SWEEP SINGLE.
(g)
(80) When sweep is completed press TI SWEEP SINGLE key and wait for the sweep
to finish.
(81) Press TI MARKER PEAK SEARCH key.
(82) The marker amplitude indicated on TI display will be within limits specified in
the first row of table 43.
70