
TB 9-6625-2340-24
(93) Repeat the technique used in (89) (d) through (g) and (90) through (92) above
using remaining TI and synthesized signal generator No. 1 settings in table 44. The
marker amplitudes indicated on TI display will be within limits specified in table 44.
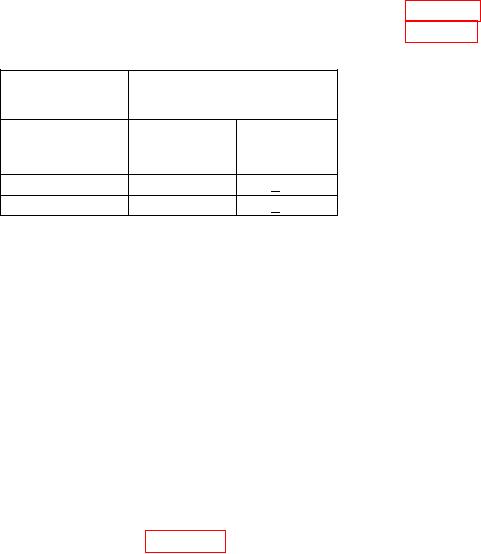
Table 44. Multiple Responses
Synthesized
Test
signal generator
instrument
No. 1
Frequency
Center freq.
Displayed
setting
amplitude
(GHz)
limit (dB)
(GHz)
< 60
15.0
10.107133
< 60
15.0
10.535667
b. Adjustments. None.
24. Gain Compression
a. Performance Check
(1) Press TI keys as listed in (a) through (e) below:
2-22 GHz.
(a)
SHIFT.
(b)
ATTEN.
(c)
SHIFT.
(d)
0-2.5 GHz, 0, dBm.
(e)
(2) Connect measuring receiver sensor module to measuring receiver power
reference output.
(3) Zero and calibrate the sensor module.
(4) Connect equipment as shown in figure 30.
(5) Set synthesized signal generator No. 1 output frequency to 2.0 GHz and an
output level of 14 dBm.
(6) Press TI keys as listed in (a) through (c) below:
(a) CENTER FREQUENCY, 2, GHz.
(b) FREQUENCY SPAN, 0, Hz.
(c) ATTEN, 0, dBm.
(7) Set up measuring receiver to measure RF power.
(8) Adjust synthesized signal generator No. 1 output level for a 20.00 0.05 dBm
indication on measuring receiver.
(9) Press TI keys as listed in (a) through (f) below:
REFERENCE LEVEL, 10, dBm.
(a)
VIDEO BW, 30, Hz.
(b)
SCALE LIN.
(c)
SHIFT.
(d)
AUTOA.
(e)
MARKER NORMAL.
(f)