TB 9-4931-488-24
(3) Connect spectrum analyzer sensor to TI RF OUTPUT.
(4) Position controls as listed in (a) through (e) below.
(a) LEVEL VOLTS pushbutton pressed.
(b) RANGE MHz switch to 1 - .5 MHz.
(e) OUTPUT LEVEL switch to +10 dBm.
(d) RF OFF/ON switch to ON.
(e) COUNTER MODE EXPAND X10 pushbutton pressed.
(5) Adjust FREQUENCY TUNE control for a FREQUENCY MHz display
indication of 0.5 MHz and OUTPUT LEVEL vernier control(s) fully cw.
(6) Position spectrum analyzer controls as necessary to obtain conditions listed in
(a) and (b) below.
(a) Attenuation 40 dB.
(b) Reference level to 15 dB.
(7) Set spectrum analyzer Start Freq and Stop Freq to values listed in table 3.
(8) Press the spectrum analyzer key sequence in (a) through (d) below:
(a) Peak Search.
(b) Marker.
(c) Delta.
(d) Peak Search, Next Peak.
(9) Spectrum analyzer should be within Mkr1 indication listed in table 3.
(10)Press spectrum analyzer Next Peak for each harmonic peak displayed. Spectrum
analyzer should be within Mkr1 indication listed in table 3.
(11)Repeat technique of (4) through (10) above for remaining frequencies in table 3.
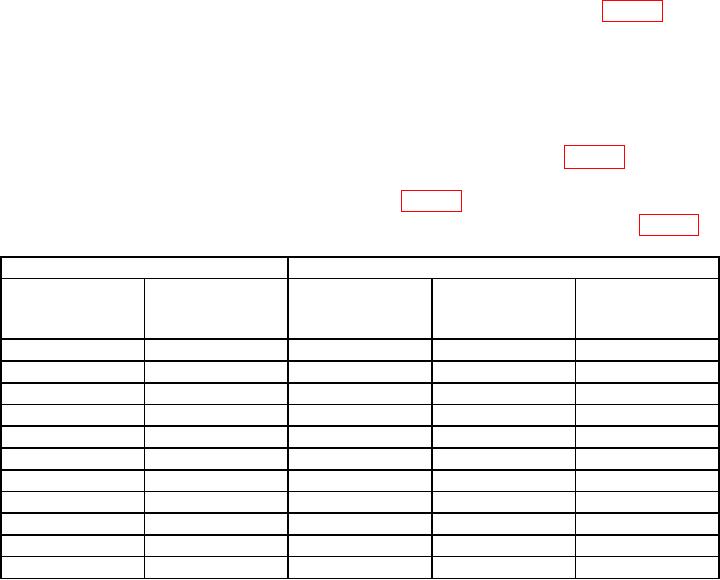
Table 3. Harmonic Distortion Accuracy.
Test instrument
Spectrum analyzer
Max Mkr1
FREQUENCY MHz
indication
Start Freq
Stop Freq
RANGE MHz
display
Harmonics ≥ dB
(Hz)
(Hz)
switch setting
(MHz)
below fundamental
1 - 0.5
0.5
400 k
2.6
M
-30
2-1
1
900 k
5.1
M
-30
4-2
2
1.9 M
11
M
-30
8-4
4
3.9 M
21
M
-30
16 - 8
8
7.9 M
41
M
-30
32 - 16
16
15
M
81
M
-30
64 - 32
32
31
M
161
M
-30
128 - 64
64
63
M
321
M
-30
256 - 128
128
127 M
640
M
-30
512 - 256
256
250 M
1.3
G
-30
512 - 256
512
500 M
2.6
G
-30
9

