
TB 9-6625-2155-24
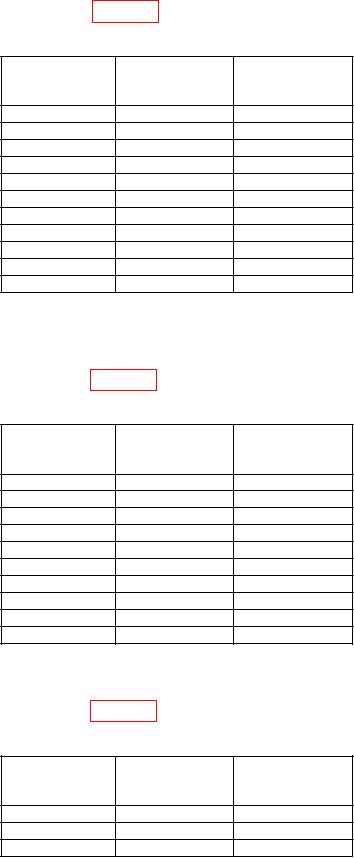
(8) Press TI FREQUENCY, 12, and GHz keys. Using tuned level measurement
techniques, verify that the measuring receiver indicates within minimum and maximum
limits for TI output levels listed in table 11.
Table 11. 12 GHz Output Level Test
Test
instrument
output level
Min
Max
0
-2
2
-10
-12
-8
-20
-22
-18
-30
-32
-28
-40
-42
-38
-50
-52
-48
-60
-62
-58
-70
-73.5
-66.5
-80
-83.5
-76.5
-90
-93.5
-86.5
-100
-103.5
-96.5
(9) Press TI FREQUENCY, 12.5, and GHz keys. Using tuned level measurement
techniques, verify that the measuring receiver indicates within minimum and maximum
limits for TI output levels listed in table 12
Table 12. 12.5 GHz Output Level Test
Test
instrument
output level
Min
Max
0
-3
3
-10
-13
-7
-20
-23
-17
-30
-33
-27
-40
-43
-37
-50
-53
-47
-60
-63
-57
-70
-74.5
-65.5
-80
-84.5
-75.5
-90
-94.5
-85.5
(10) Press TI FREQUENCY, 18, and GHz keys. Using tuned level measurement
techniques, verify that the measuring receiver indicates within minimum and maximum
limits for TI output levels listed in table 13
Table 13. 18 GHz Output Level Test
Test
instrument
output level
Min
Max
0
-3
3
-10
-13
-7
-17
13